
FMGE PSM Image Based Questions
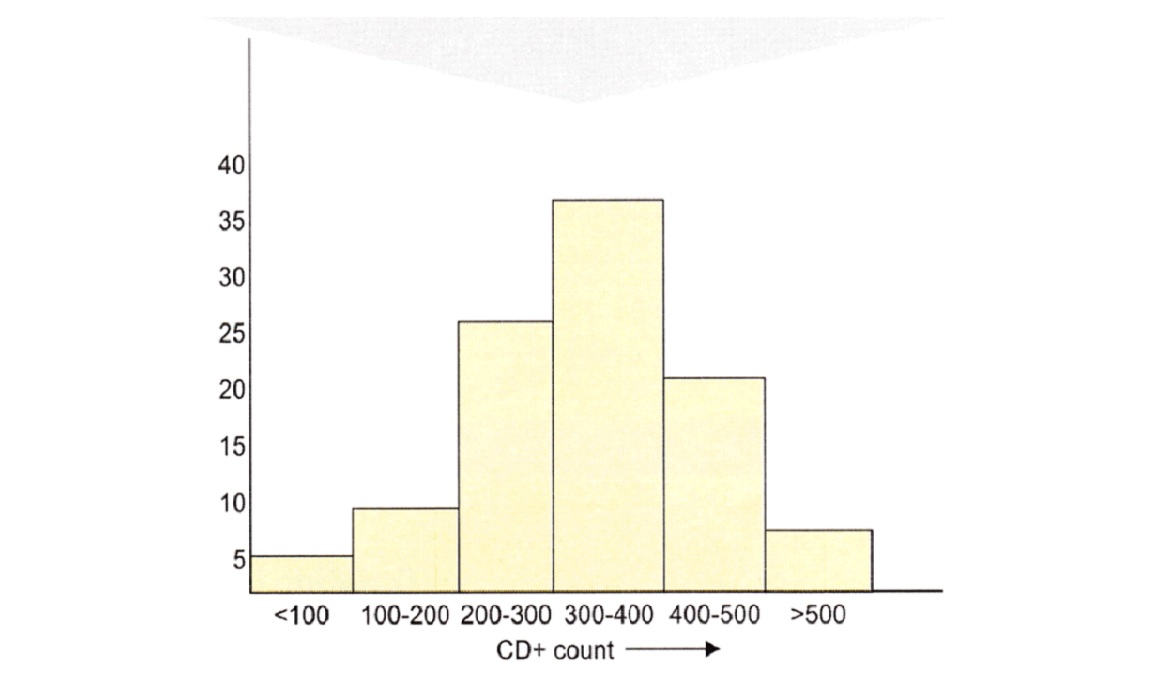
Photograph shows a graph of CD4 count among HIV patients. Calculate the mean CD4 count, considering that Normal CD4 count is less than 1500.
Correct!
Wrong!
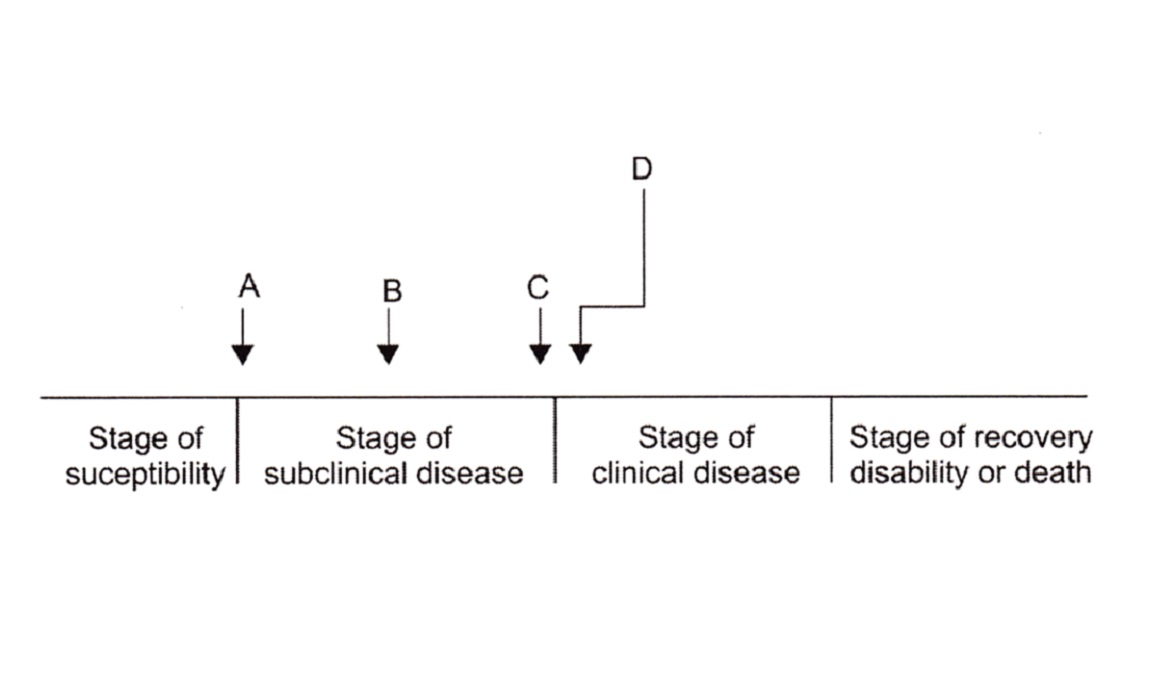
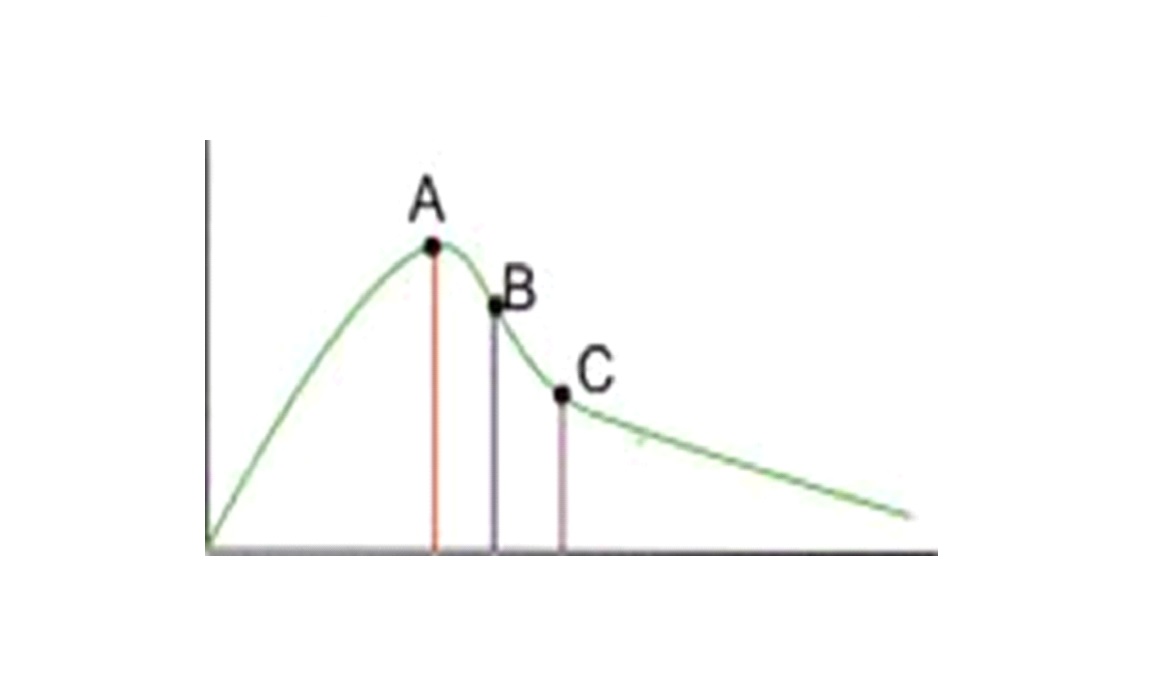
Identify point in the Photograph given below (Natural history of disease) which represents the onset of symptoms?
Correct!
Wrong!
Which Biomedical waste is disposed in BMW colour coded bag shown in Photograph?

Correct!
Wrong!
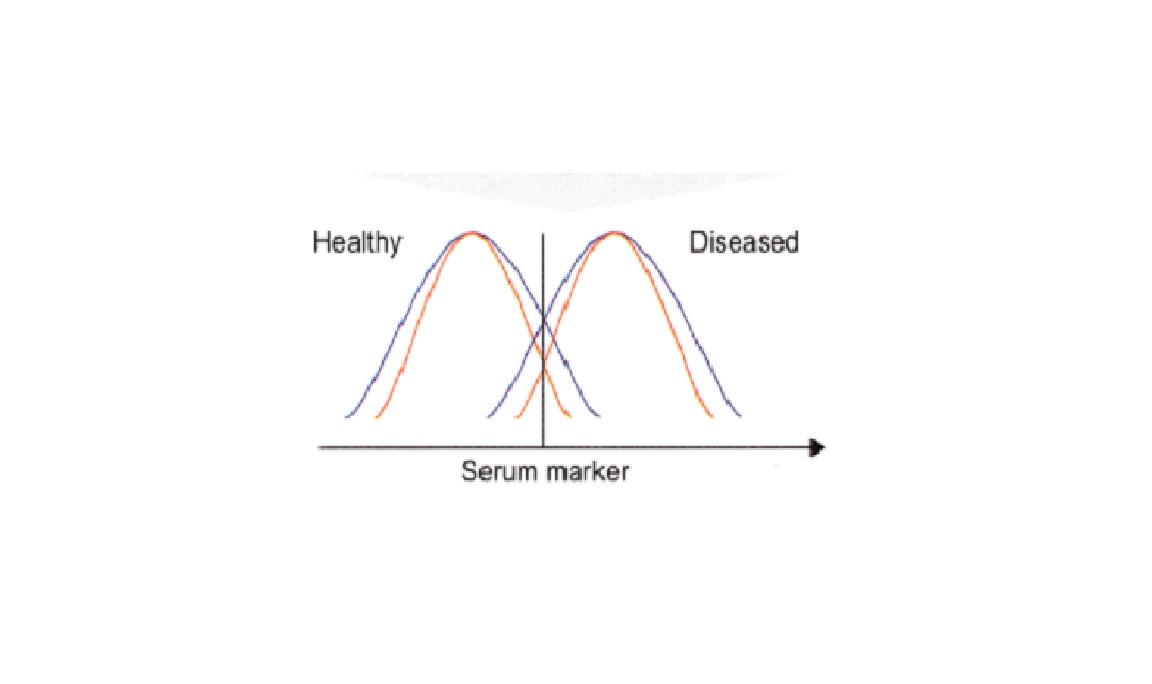
Given are the curves for Screening of a disease in a population. Changes expected in Sensitivity and Specificity if curve changes from Blue to Red?
Correct!
Wrong!
In an agreement between Sp02 of two groups with and without micropore in a pediatric population the values spotted is as below. Which of the following is true?
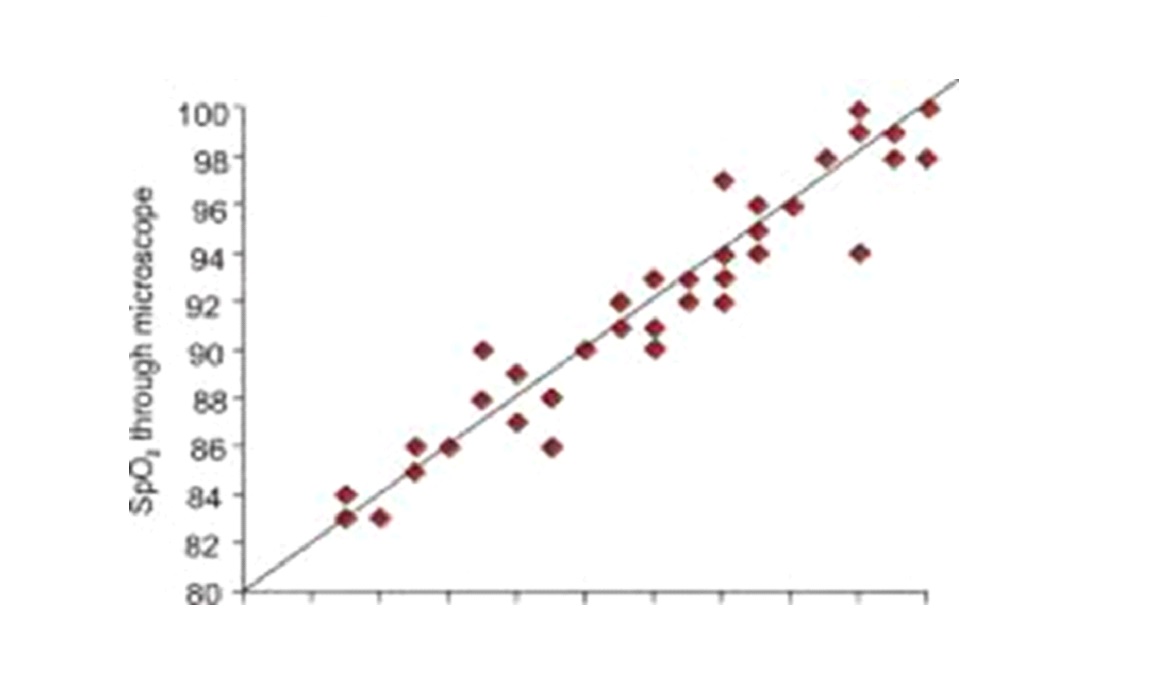
Correct!
Wrong!
A scatter diagram was plotted as shown below to study the relationship between two quantitative variables. What is the correct interpretation?
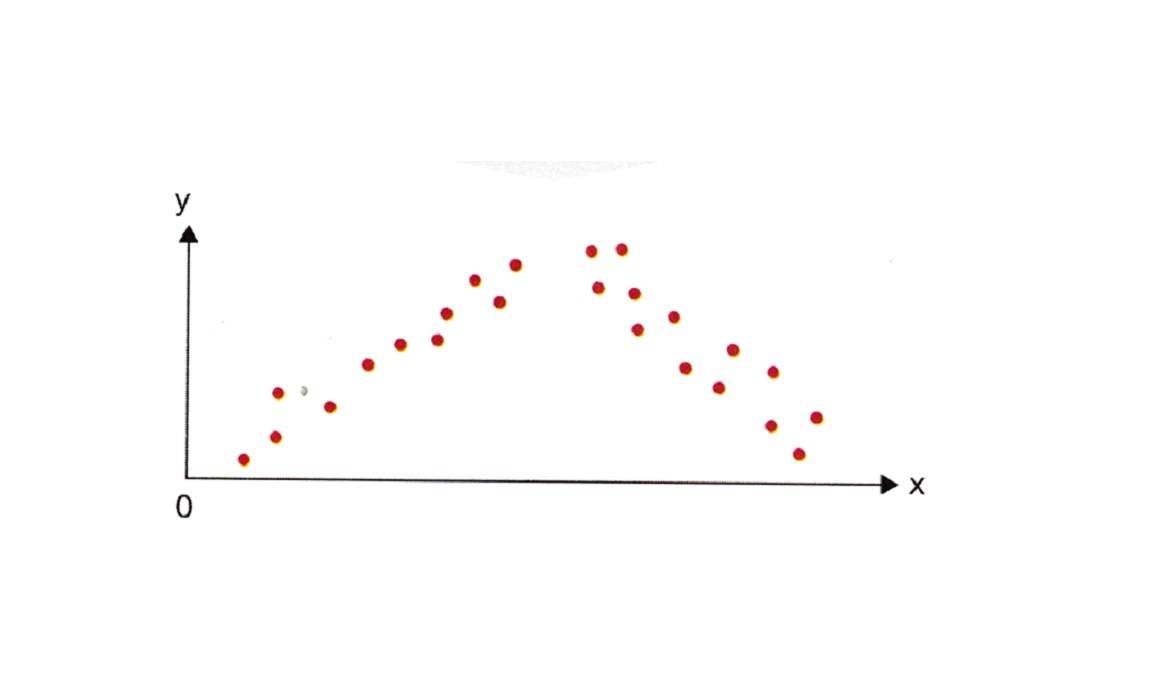
Correct!
Wrong!
A study was conducted to find out number of positive lymph nodes in a population of breast cancer patients who underwent axillary dissection. A graph was plotted between the number and frequency of positive nodes as below. Which of the following is the correct statement?
Correct!
Wrong!
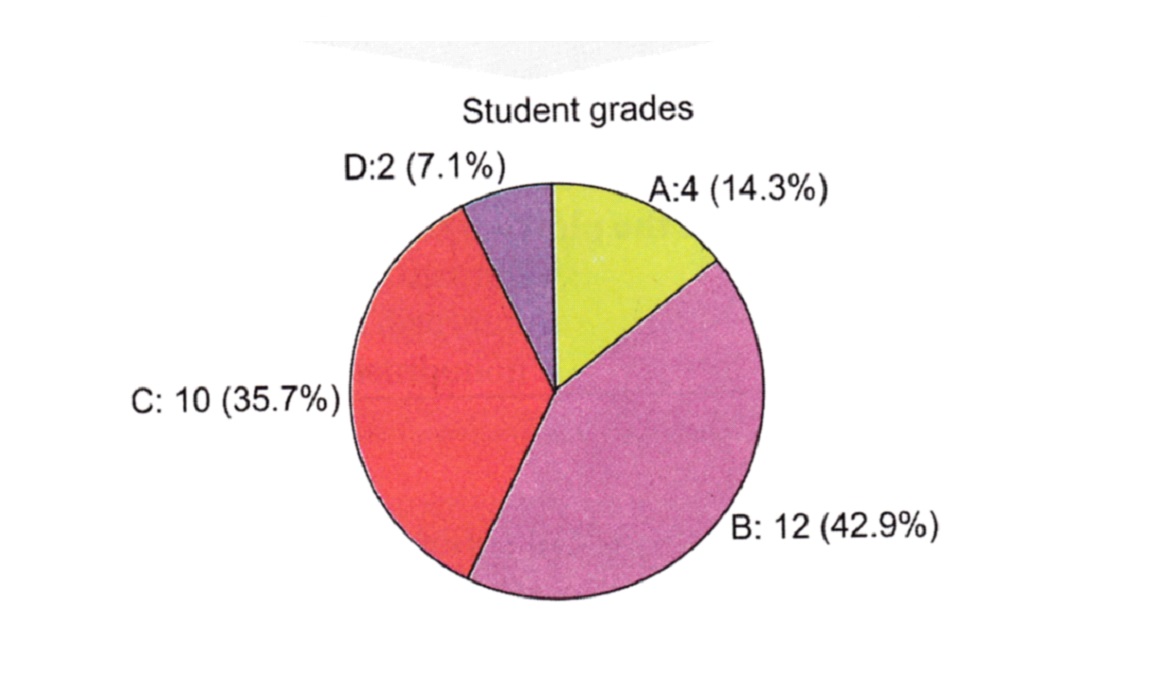
Identify the Statistical diagram shown in Photograph
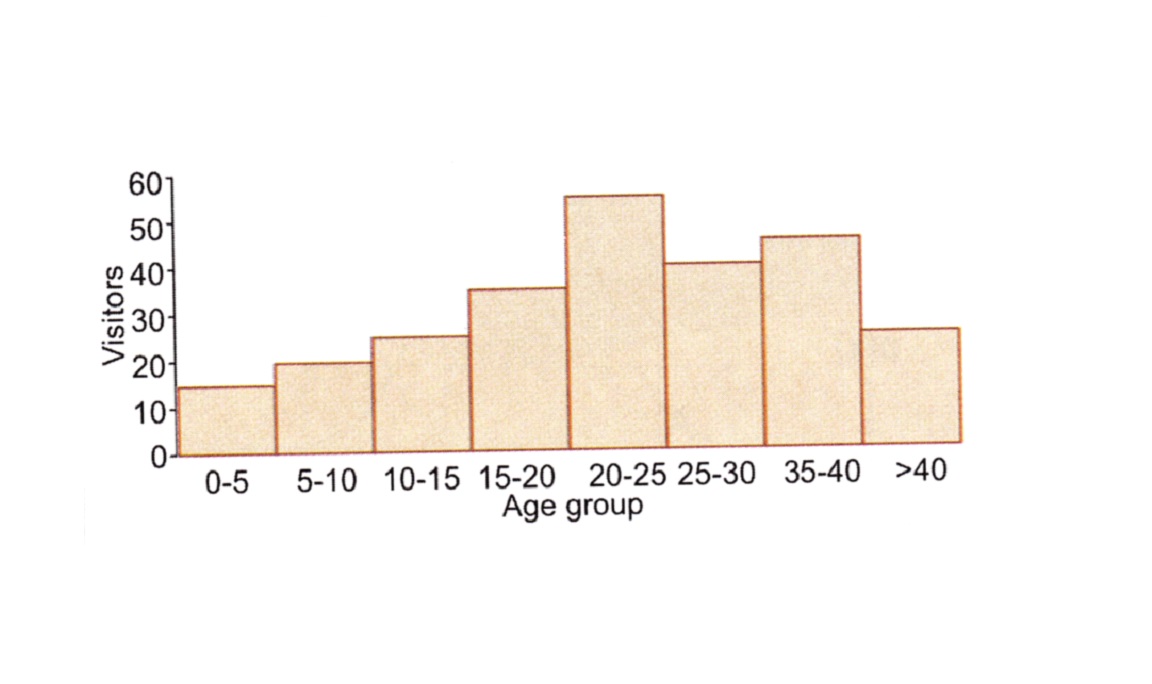
Correct!
Wrong!
Identify the Statistical diagram shown in Photograph
Correct!
Wrong!
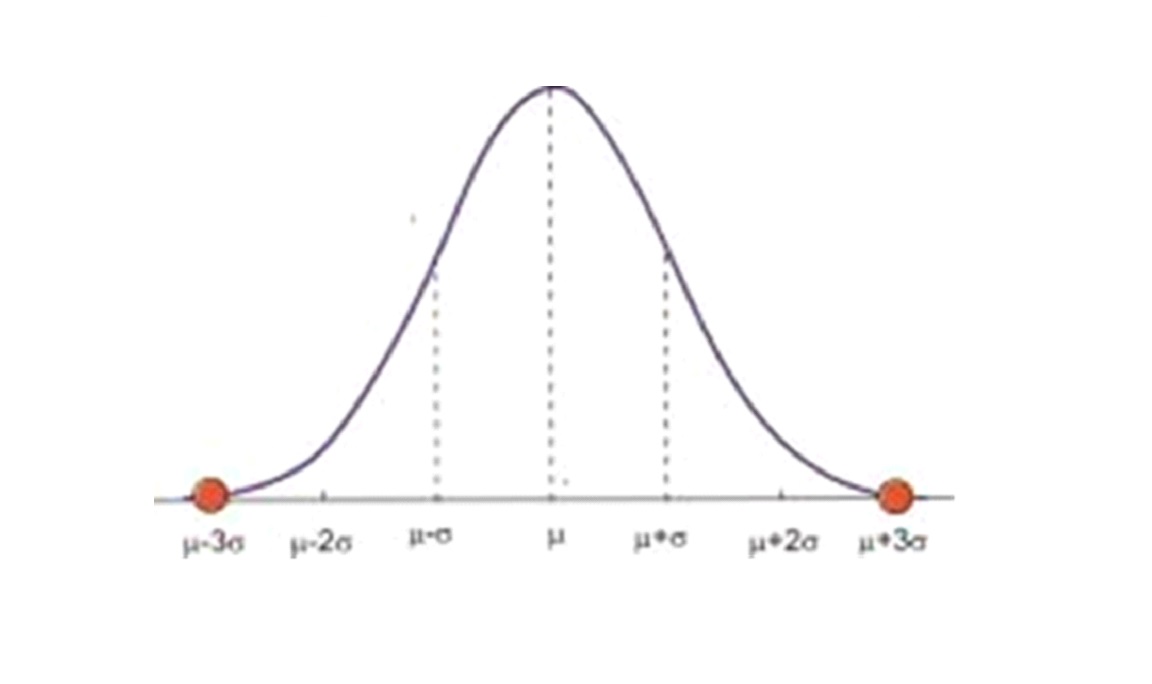
In the diagram depicted here, how much is the area between points A & B, on either side of the mean?
Correct!
Wrong!
FMGE PSM Image Based Questions


| How to Prepare PSM for FMGE? | How to Prepare PSM for FMGE? |
 |
 |
Related Tests: